The last few weeks are saying exactly nothing about the next 30 years – whether it’s about politics, science or the stock market. Nonetheless, financial professionals are evaluating risks based on deviations from the index: The more a stock strays from the index, the higher its risk.
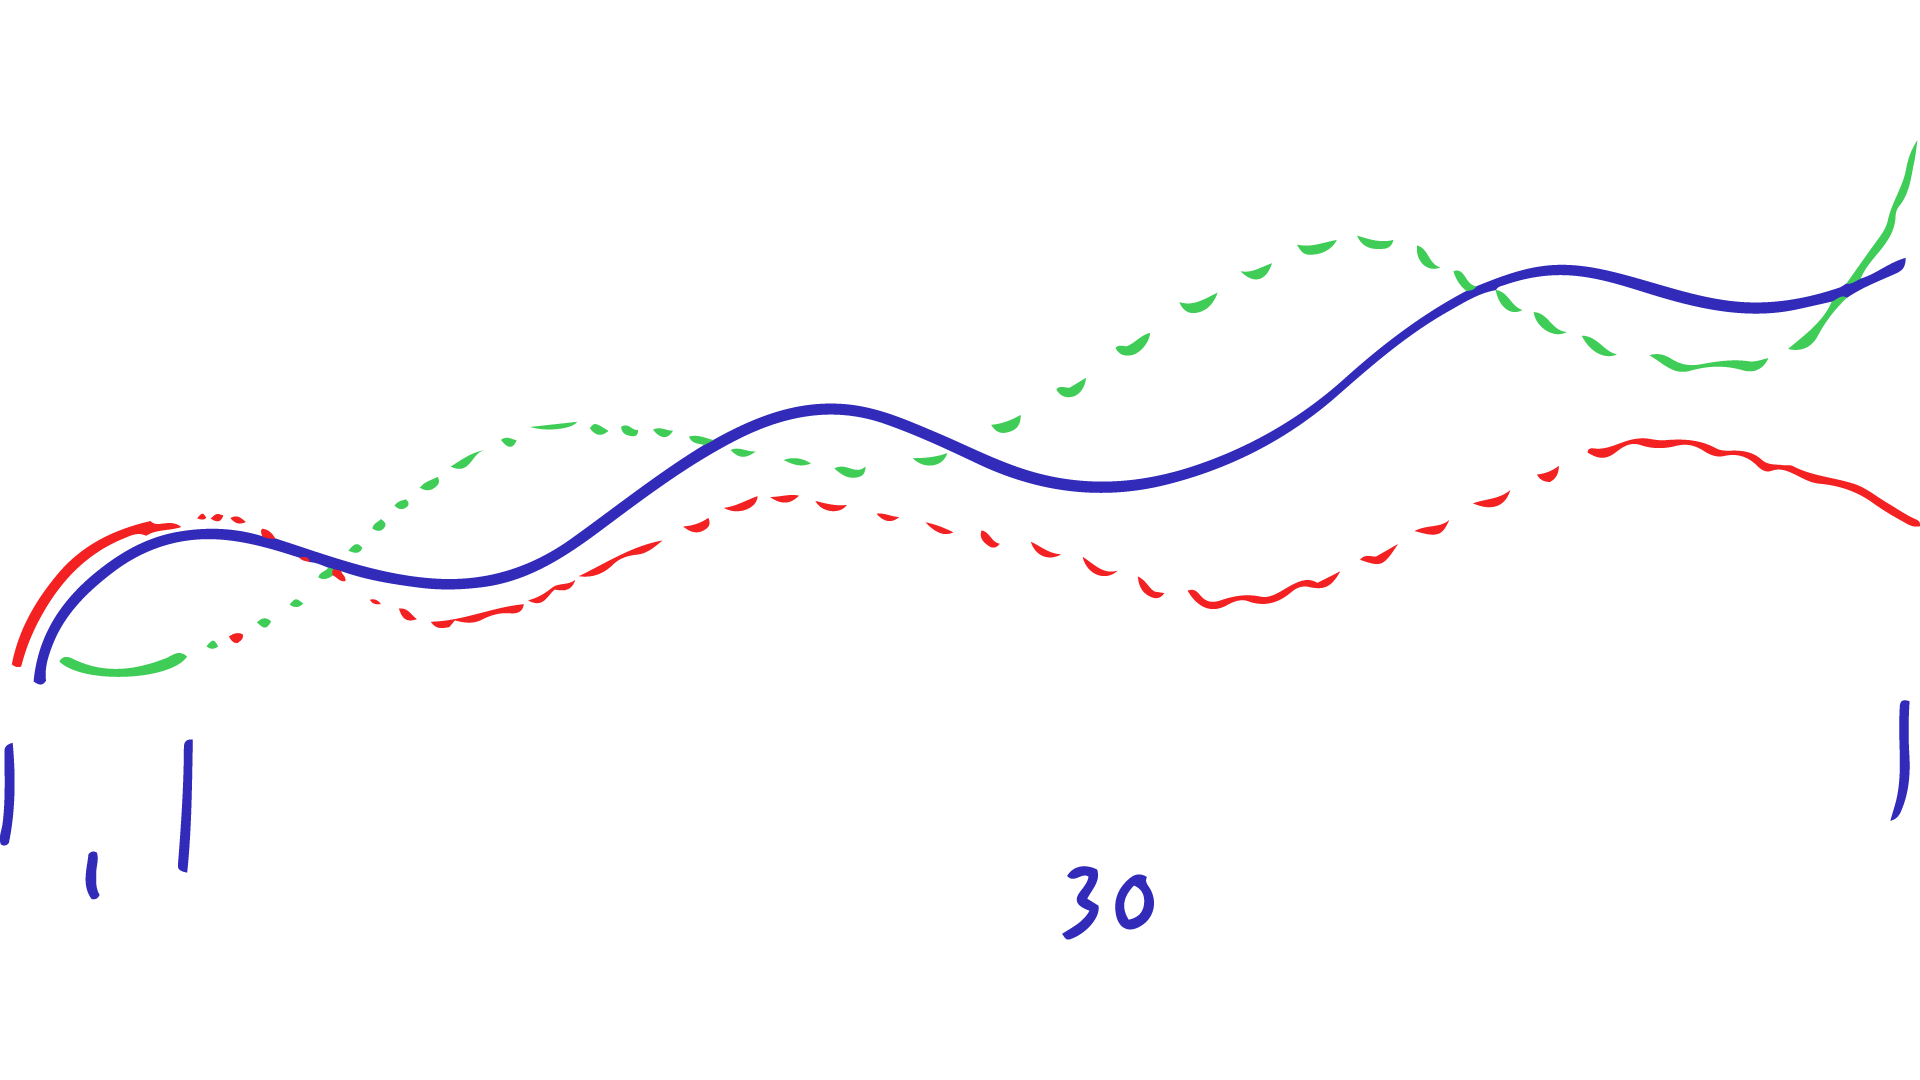
However, this approach is completely wrong, as we can see from the following illustration, which we will discuss in more detail in the video:
Let’s say we have a specific index (blue) and two stocks red and green. The past year «1», bounded by two lines on the left side, shows that the red stock was closer to the index during this period than the green one - and therefore less exposed to risk. In this example, this situation will stay the same for the next few years.
However, the more time passes – here the total time frame is 30 years – the more the value of the green stock increases. Even though it always develops differently than the index. The example shows: Closeness to the index does not necessarily equal low risk.
So if you evaluate the performance of a stock on the deviation from the index, you’re making two mistakes at once. First, the last few quarters don’t carry a lot of weight if stocks are bought for decades. Second, the performance of a stock is especially good if you find stocks that are different from the index and achieve higher returns in the end.
This is not that unrealistic: If the red stock is an oil stock, then it is very dependent on today’s oil-dominated economy and naturally goes up and down with the economy index. A wind or water power stock has a lot less economic significance and therefore experiences completely different swings. Does that mean that you should avoid renewable energy stocks only because they have different swings than the index?
Obviously not. The deviation from the index is completely useless for evaluating the performance of stocks. Despite the fact that some lucky professors have even received the Nobel Prize for corresponding figures.